 Benefits
 Dashboard
Not registered yet? Get a free account.
Sign Up


BAJAJ HOUSING FINANCE LIMITED
Leave site?
You're about to leave our website and go to an external link. Are you sure?
Bajaj Housing Finance Limited is a leading financial services company in India that specializes in providing housing finance solutions. It offers a range of products including home loans, mortgage loans, and loan against property, catering to individual and institutional clients while addressing their housing and investment needs.
Bajaj Housing Finance Limited, is a listed public company incorporated on 13 June, 2008. It is classified as a public limited company and is located in Pune, Maharashtra. It's authorized share capital is INR 9,000.00 cr and the total paid-up capital is INR 8,332.33 cr.
Read more

 Buy Dashboard using Credits
 Buy Dashboard using Credits


- Home Loan, Balance Transfer Loan, Against Property Loan, Developer Finance etc, Against Property For Professionals
** All rupee values in INR crores. Based on March 2024 numbers.
 34.46%
39.42%
37.64%
16.47%
28.62%
26.56%
3.21
0.53
2.17
 -98.15
0.53
 Buy Report or Plans
 Buy Report or Plans

Dashboards
Popular Plan-
₹ 449
 Company dashboard
-
 Five year financials and ratios
-
Risk analysis
-
Interactive charts
-
 Company dashboard

Buy credits

View subscriptions
MCA Fillings
-
₹ 349
All financials
-
All financials
-
All annual returns
-
MoA and AoA
-
-
₹ 249
1 Year
-
Latest financials
-
Latest annual return
-
MoA and AoA
-
PDF Reports
-
₹ 799
Financial report
-
Five year financials and ratios
-
Shareholding and group structure
-
-
₹ 1299
Financial+Litigation report
-
Everything in financial report
-
Litigation report on the company
-
-
₹ 2999
Due diligence report
-
Everything in financial+litigation report
-
Peers and financials
-

* GST not included
** Reports & MCA filings will be based on the latest available financials.
** Delivery timelines are on best-effort basis during working hours. Filings 3-4 hours. Reports 24-48 hours.
 Choose number of credits to buy


₹ 449 + GST
* INR 349 for 20+ credits purchase
1 credit = one company dashboard
Locations
 India
(1)
| State | Type | Address |
|---|
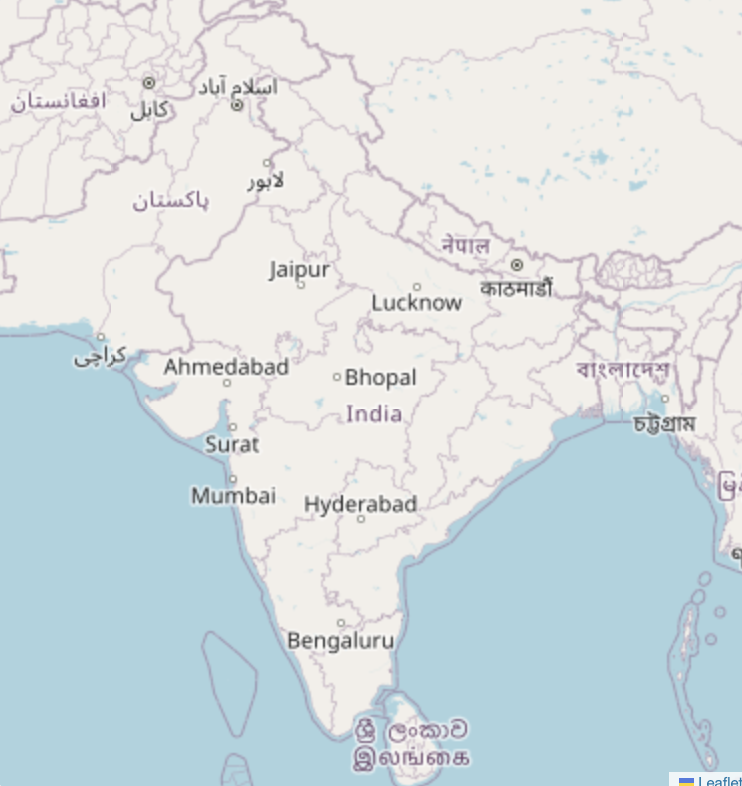
 Locations on Map
 Locations on Map
 Filter (4)
 Filter (4)
Select Tags
Choose Location
People
| Designation | Name | DIN/PAN | Tenure |
|---|---|---|---|
| Director | Rajeev Jain
Shareholder
|
01550158 | 12 years |
| Director | Arindam Bhattacharya | 01570746 | 4 years |
| Cfo | Gaurav Kalani | 03318661 | 9 years |
| Managing Director | Atul Jain
Shareholder
|
09561712 | 4 years |
| Director | Sanjivnayan Bajaj
Shareholder
|
00014615 | 8 years |
| Director | Anami Narayan Prema Roy | 01361110 | 6 years |
| Director | Jasmine Arish Chaney | 07082359 | 3 years |
| Director | Ajay Kumar Choudhary | 09498080 | 1 years |
| Director | Srirama Madakasira Narasimha Swamy | 10367727 | 2 years |
Financial Highlights
| Mar 2020 | Mar 2021 | Mar 2022 | Mar 2023 | Mar 2024 | |
|---|---|---|---|---|---|
| Sales | 2,646.0 | 3,154.7 | 3,766.7 | 5,664.7 | 7,617.3 |
| Operating profit | 2,206.4 | 2,600.2 | 3,140.5 | 4,944.1 | 6,893.1 |
| Net profit | -146.1 | 453.2 | 709.6 | 1,257.8 | 1,731.2 |
| Gross margin | - | - | - | - | - |
| Operating margin | 83.4 | 82.4 | 83.4 | 87.3 | 90.5 |
| Net margin | -5.5 | 14.4 | 18.8 | 22.2 | 22.7 |
| Networth | 5,585.1 | 6,032.2 | 6,741.4 | 10,503.2 | 12,233.5 |
| Borrowings | 25,600.4 | 31,600.6 | 41,492.3 | 53,745.4 | 69,129.3 |
| Assets | 31,372.4 | 37,859.3 | 48,527.1 | 64,654.2 | 81,827.1 |
| Debt to equity | 4.6 | 5.2 | 6.2 | 5.1 | 5.7 |
| Current ratio | - | - | - | - | - |
| ROE | -2.6 | 7.5 | 10.5 | 12.0 | 14.2 |
| Days payable | - | - | - | - | - |
| WC days | - | - | - | - | - |

Margins
Balance Sheet
| Mar 2020 | Mar 2021 | Mar 2022 | Mar 2023 | Mar 2024 | |
|---|---|---|---|---|---|
| Equity Capital | 4,883.3 | 4,883.3 | 4,883.3 | 6,712.2 | 6,712.2 |
| Reserves | 701.8 | 1,148.9 | 1,858.0 | 3,791.0 | 5,521.3 |
| Borrowings + | 25,600.4 | 31,600.6 | 41,492.3 | 53,745.4 | 69,129.3 |
| Long term borrowings | 25,600.4 | 31,600.6 | 41,492.3 | 53,745.4 | 69,129.3 |
| Short term borrowings | - | - | - | - | - |
| Trade payables + | 30.6 | 20.9 | 36.4 | 45.9 | 57.6 |
| Days payable | - | - | - | - | - |
| Other liabilities + | 156.2 | 205.6 | 257.0 | 359.7 | 406.7 |
| Other non-current liabilities | 11.4 | - | - | 28.3 | - |
| Other current liabilities | 144.8 | 205.6 | 257.0 | 331.4 | 406.7 |
| Total liabilities | 31,372.4 | 37,859.3 | 48,527.1 | 64,654.2 | 81,827.1 |
| Fixed Assets + | 85.8 | 78.9 | 98.7 | 113.3 | 123.7 |
| Tangible assets | 77.8 | 64.3 | 78.1 | 84.9 | 87.5 |
| CWIP | - | - | 1.5 | 0.3 | 0.9 |
| Intangible assets | 8.0 | 14.6 | 19.1 | 28.1 | 35.4 |
| LT loans and advances | 27,975.4 | 33,418.9 | 46,482.1 | 62,113.9 | 79,300.8 |
| Other non-current assets | 2,523.0 | 3,584.7 | 1,292.9 | 2,326.1 | 2,282.6 |
| Current assets + | 788.2 | 776.9 | 653.4 | 100.8 | 120.0 |
| Inventories | - | - | - | - | - |
| Trade receivables | 118.4 | 310.7 | 237.3 | 1.6 | 13.4 |
| Cash and cash equivalents | 658.7 | 461.8 | 407.0 | 93.9 | 63.9 |
| ST loans and advances | - | - | - | - | - |
| Other current assets | 11.1 | 4.5 | 9.1 | 5.3 | 42.7 |
| Total assets | 31,372.4 | 37,859.3 | 48,527.1 | 64,654.2 | 81,827.1 |

Total assets
Profit & Loss
| Mar 2020 | Mar 2021 | Mar 2022 | Mar 2023 | Mar 2024 | |
|---|---|---|---|---|---|
| Sales + | 2,646.0 | 3,154.7 | 3,766.7 | 5,664.7 | 7,617.3 |
| Sales growth % | 130.26 | 19.22 | 19.4 | 50.39 | 34.47 |
| Expenses + | 2,078.8 | 2,542.1 | 2,807.3 | 3,965.4 | 5,456.4 |
| Cost of goods | - | - | - | - | - |
| Employee cost | 248.5 | 245.8 | 348.8 | 435.1 | 465.6 |
| Other costs | 191.1 | 308.7 | 277.4 | 285.5 | 258.5 |
| Operating profit + | 2,206.4 | 2,600.2 | 3,140.5 | 4,944.1 | 6,893.1 |
| Operating margin % | 83.4 | 82.4 | 83.4 | 87.3 | 90.5 |
| Other income | 0.2 | 0.6 | 0.5 | 0.7 | 0.4 |
| Interest | 1,616.0 | 1,965.9 | 2,155.3 | 3,211.3 | 4,692.6 |
| Depreciation | 23.1 | 21.8 | 25.8 | 33.4 | 39.6 |
| Exceptional items | - | - | - | - | - |
| Profit before tax | 567.4 | 613.2 | 959.9 | 1,700.1 | 2,161.3 |
| Tax | 146.1 | 160.0 | 250.2 | 442.3 | 430.1 |
| Profit - disc. ops | - | - | - | - | - |
| Net profit | -146.1 | 453.2 | 709.6 | 1,257.8 | 1,731.2 |
| Net margin % | -5.5 | 14.4 | 18.8 | 22.2 | 22.7 |
Revenue from operations
Ratios
| Mar 2020 | Mar 2021 | Mar 2022 | Mar 2023 | Mar 2024 | |
|---|---|---|---|---|---|
| Solvency + | |||||
| Total Debt/Equity | 4.6 | 5.2 | 6.2 | 5.1 | 5.7 |
| Net Debt/Equity | 4.5 | 5.2 | 6.1 | 5.1 | 5.7 |
| Total Debt/Assets | 0.8 | 0.8 | 0.9 | 0.8 | 0.8 |
| Total Assets/Equity | 5.6 | 6.3 | 7.2 | 6.2 | 6.7 |
| Liquidity + | |||||
| Current Ratio | - | - | - | - | - |
| Quick Ratio | - | - | - | - | - |
| Interest Coverage | - | - | - | - | - |
| Performance | |||||
| Gross Margin | - | - | - | - | - |
| Operating Margin | 83.4 | 82.4 | 83.4 | 87.3 | 90.5 |
| Net Margin | -5.5 | 14.4 | 18.8 | 22.2 | 22.7 |
| Return + | |||||
| Return on Equity | -2.6 | 7.5 | 10.5 | 12.0 | 14.2 |
| Pre-tax ROCE | 312.5 | 409.8 | 679.1 | -3,009.2 | -3,107.3 |
| Return on Assets | -0.5 | 1.2 | 1.5 | 1.9 | 2.1 |
| Pre-tax ROIC | 7.2 | 6.9 | 6.5 | 7.7 | 8.4 |
| Efficiency + | |||||
| Days Payable | - | - | - | - | - |
| Days Inventory | - | - | - | - | - |
| Days Receivable | - | - | - | - | - |
| Fixed Asset Turnover | 30.9 | 40.0 | 38.2 | 50.0 | 61.6 |
| Total Asset Turnover | 0.1 | 0.1 | 0.1 | 0.1 | 0.1 |
| Working Capital | |||||
| Cash Conversion Cycle | - | - | - | - | - |
| Working Capital Days | - | - | - | - | - |
Ratios
Charges on assets
Catalyst Trusteeship Limited
No. of Loans: 50
Total Amount : 119,667.0 cr
National Housing Bank
No. of Loans: 5
Total Amount : 15,335.7 cr
Catalyst Trustee
No. of Loans: 1
Total Amount : 750.0 cr
Others
No. of Loans: 1
Total Amount : 500.0 cr
The Federal Bank Limited
No. of Loans: 1
Total Amount : 0.0 cr
Punjab National Bank
No. of Loans: 1
Total Amount : 0.0 cr
IDBI Bank Limited
No. of Loans: 1
Total Amount : 0.0 cr
The Shamrao Vithal Co-operative Bank Limited
No. of Loans: 1
Total Amount : 0.0 cr
DBS BANK INDIA LIMITED
No. of Loans: 1
Total Amount : 0.0 cr
Central Bank of India
No. of Loans: 1
Total Amount : 0.0 cr
Indian Bank
No. of Loans: 1
Total Amount : 0.0 cr
Canara Bank
No. of Loans: 1
Total Amount : 0.0 cr
THE COSMOS BANK LIMITED
No. of Loans: 1
Total Amount : 0.0 cr
Bank of Baroda
No. of Loans: 1
Total Amount : 0.0 cr
The Karur Vysya Bank Limited
No. of Loans: 1
Total Amount : 0.0 cr
BANDHAN BANK LIMITED
No. of Loans: 1
Total Amount : 0.0 cr
Bank of India
No. of Loans: 1
Total Amount : 0.0 cr
Union Bank of India
No. of Loans: 1
Total Amount : 0.0 cr


Charges
Company Network

Companies connected through Directors
Subsidiary Companies
| Name | State / Country | Incorporation Year | Paidup Capital |
|---|---|---|---|
| BAJAJ FINANCIAL SECURITIES LIMITED | Maharashtra | 2010 | ₹ 1,258.7 Cr |
Tofler Score

Risk
 Severe Risk
- No risks identified
Moderate Risk
- HIGH LEVERAGE
- LOW INTEREST COVERAGE
Low Risk
- NET MARGIN DETERIORATING
About Tofler Score
Read more
Registered Details
CIN
L65910PN2008PLC132228Incorporation
2008, 18.4 yearsCompany Email
ATUL.PATNI@BAJAJHOUSING.CO.INPaid up Capital
₹ 8,332.3 CrAuthorised Capital
₹ 9,000.0 CrAGM
Jul 2026Type
FAQ - BAJAJ HOUSING FINANCE LIMITED
What is the incorporation date of BAJAJ HOUSING FINANCE LIMITED?

The incorporation date of BAJAJ HOUSING FINANCE LIMITED is 13 June, 2008
What is the authorized share capital of BAJAJ HOUSING FINANCE LIMITED?
The authorized share capital of BAJAJ HOUSING FINANCE LIMITED is INR ₹ 9,000.0 Cr.
What is the paid-up capital of BAJAJ HOUSING FINANCE LIMITED?
The paid-up capital of BAJAJ HOUSING FINANCE LIMITED is INR ₹ 8,332.3 Cr.
What is the registered address of BAJAJ HOUSING FINANCE LIMITED?
The registered address of BAJAJ HOUSING FINANCE LIMITED is 4th Floor, Bajaj Finserv House, Off Pune Ahmednagar Road Pune Maharashtra - 411014
What is the CIN number of BAJAJ HOUSING FINANCE LIMITED?
The CIN number of BAJAJ HOUSING FINANCE LIMITED is L65910PN2008PLC132228.
Smart Suggestions
- Top Security Companies In India
- Highest Tax Paying Companies
- Best Matrimonial Sites
- Top Seed Companies In India
- Fortune 500 Companies In India
- ITC Products List
- Hindustan Unilever Products List
- Top Fan Brands
- Top Indian Companies By Revenue
- How To Check Directors Of A Company
- Automobile Parts Manufacturing Companies In India
- Forging Companies In India
- List Of Government Companies
- Road Construction Companies
- Top Engineering Companies
- Largets Banks By Market Cap
- Eyewear Companies In India
- Top Petrochemical Companies
- Manufacturing Companies In Coimbatore
- Medical Equipment Manufacturing Companies
- Top Companies In Odisha
- Financial Companies In India
- Top Mining Companies
- Top 10 Plastic Companies
- Leather Manufacturing Companies
