 Benefits
 Dashboard
Not registered yet? Get a free account.
Sign Up


MEDHA SERVO DRIVES PVT LTD
www.medhaindia.comLeave site?
You're about to leave our website and go to an external link. Are you sure?
Medha Servo Drives Pvt Ltd is an engineering company specializing in the design and manufacture of control systems and electronic components for railways and electric vehicles. It offers a diverse range of products such as traction converters, control solutions, and electric drive systems, significantly enhancing operational efficiency and safety in transportation systems.
Medha Servo Drives Pvt Ltd, is an unlisted private company incorporated on 27 January, 1984. It is classified as a private limited company and is located in Telangana, Telangana. It's authorized share capital is INR 21.00 cr and the total paid-up capital is INR 19.65 cr.
Read more

 Buy Dashboard using Credits
 Buy Dashboard using Credits


- high-tech electronics products for application on locomotives, Fuel Saving Solutions, Signaling, coaches, Rolling Stock Equipment, Propulsion Systems, railway stations and yards
** All rupee values in INR crores. Based on March 2025 numbers.
 2.75%
9.28%
6.92%
23.85%
16.48%
0.66
1.39
0.8
 -3.26
-4.89
 Buy Report or Plans
 Buy Report or Plans

Dashboards
Popular Plan-
₹ 449
 Company dashboard
-
 Five year financials and ratios
-
Risk analysis
-
Interactive charts
-
 Company dashboard

Buy credits

View subscriptions
MCA Fillings
-
₹ 349
All financials
-
All financials
-
All annual returns
-
MoA and AoA
-
-
₹ 249
1 Year
-
Latest financials
-
Latest annual return
-
MoA and AoA
-
PDF Reports
-
₹ 799
Financial report
-
Five year financials and ratios
-
Shareholding and group structure
-
-
₹ 1299
Financial+Litigation report
-
Everything in financial report
-
Litigation report on the company
-
-
₹ 2999
Due diligence report
-
Everything in financial+litigation report
-
Peers and financials
-

* GST not included
** Reports & MCA filings will be based on the latest available financials.
** Delivery timelines are on best-effort basis during working hours. Filings 3-4 hours. Reports 24-48 hours.
 Choose number of credits to buy


₹ 449 + GST
* INR 349 for 20+ credits purchase
1 credit = one company dashboard
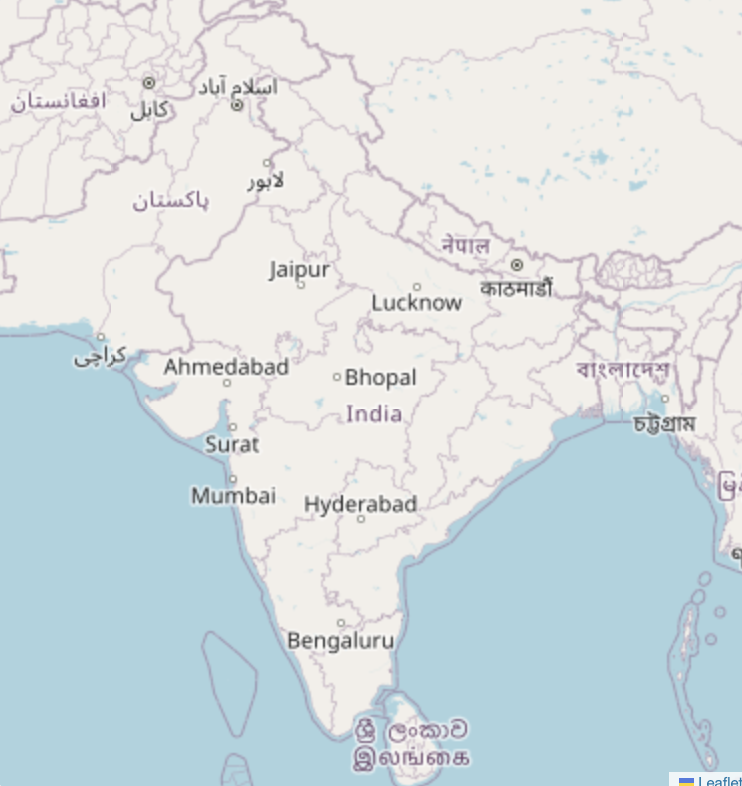
Locations
 India
(19)
| State | Type | Address |
|---|
 Locations on Map
 Locations on Map
 Filter (4)
 Filter (4)
Select Tags
Choose Location
People
| Designation | Name | DIN/PAN | Tenure |
|---|---|---|---|
| Managing Director | Kasyap Reddy Yadavelli
Shareholder
|
02088825 | 12 years |
| Director | Srinivas Reddy Nookala
Shareholder
|
01373219 | 29 years |
| Director | Vinod Kumar Agarwal
Shareholder
|
02500909 | 24 years |
| Director | Subodh Prabhakar Yeotikar
Shareholder
|
02514445 | 24 years |
| Company Secretary | Jaganmohan Gupta Chalavadi | 02398225 | 18 years |
Financial Highlights
| Mar 2021 | Mar 2022 | Mar 2023 | Mar 2024 | Mar 2025 | |
|---|---|---|---|---|---|
| Sales | 1,387.2 | 1,537.5 | 2,279.6 | 3,635.6 | 3,738.8 |
| Operating profit | 324.0 | 312.0 | 275.9 | 805.0 | 879.7 |
| Net profit | 272.7 | 284.8 | 204.5 | 735.0 | 785.9 |
| Gross margin | 46.1 | 45.4 | 34.1 | 39.0 | 39.7 |
| Operating margin | 23.4 | 20.3 | 12.1 | 22.1 | 23.5 |
| Net margin | 18.7 | 17.8 | 8.8 | 19.7 | 20.5 |
| Networth | 1,934.7 | 2,195.2 | 2,387.8 | 3,084.4 | 3,820.0 |
| Borrowings | - | - | 355.0 | - | 0.1 |
| Assets | 2,411.4 | 2,626.2 | 3,332.7 | 3,872.5 | 4,510.6 |
| Debt to equity | 0.0 | 0.0 | 0.1 | 0.0 | 0.0 |
| Current ratio | 4.2 | 4.8 | 2.8 | 3.9 | 5.4 |
| ROE | 14.1 | 13.0 | 8.6 | 23.8 | 20.6 |
| Days payable | 181.0 | 155.0 | 112.0 | 108.0 | 89.0 |
| WC days | 392.0 | 384.0 | 277.0 | 225.0 | 283.0 |

Margins
Balance Sheet
| Mar 2021 | Mar 2022 | Mar 2023 | Mar 2024 | Mar 2025 | |
|---|---|---|---|---|---|
| Equity Capital | 19.7 | 19.7 | 19.7 | 19.7 | 19.7 |
| Reserves | 1,915.1 | 2,175.6 | 2,368.1 | 3,064.7 | 3,800.4 |
| Borrowings + | - | - | 355.0 | - | 0.1 |
| Long term borrowings | - | - | - | - | - |
| Short term borrowings | - | - | 355.0 | - | 0.1 |
| Trade payables + | 371.8 | 356.8 | 459.4 | 656.2 | 547.8 |
| Days payable | 181.0 | 155.0 | 112.0 | 108.0 | 89.0 |
| Other liabilities + | 104.9 | 74.1 | 130.5 | 131.9 | 142.7 |
| Other non-current liabilities | 10.7 | 8.3 | 6.6 | 20.7 | 29.5 |
| Other current liabilities | 94.2 | 65.8 | 123.9 | 111.2 | 113.2 |
| Total liabilities | 2,411.4 | 2,626.2 | 3,332.7 | 3,872.5 | 4,510.6 |
| Fixed Assets + | 181.8 | 217.7 | 225.4 | 336.6 | 449.7 |
| Tangible assets | 133.7 | 138.4 | 212.8 | 274.5 | 265.4 |
| CWIP | 41.9 | 75.4 | 9.6 | 59.0 | 181.6 |
| Intangible assets | 6.2 | 4.0 | 3.0 | 3.0 | 2.7 |
| LT loans and advances | 119.9 | 121.5 | 67.2 | 80.6 | 68.4 |
| Other non-current assets | 153.7 | 246.4 | 372.2 | 446.2 | 433.6 |
| Current assets + | 1,956.0 | 2,040.5 | 2,667.9 | 3,009.1 | 3,558.9 |
| Inventories | 334.3 | 599.2 | 784.3 | 863.8 | 999.0 |
| Trade receivables | 818.9 | 682.8 | 1,182.6 | 956.2 | 1,226.3 |
| Cash and cash equivalents | 105.5 | 124.1 | 0.8 | 42.5 | 25.4 |
| ST loans and advances | 73.2 | 24.5 | 53.4 | 54.2 | 106.6 |
| Other current assets | 624.0 | 609.9 | 646.8 | 1,092.4 | 1,201.6 |
| Total assets | 2,411.4 | 2,626.2 | 3,332.7 | 3,872.5 | 4,510.6 |

Total assets
Profit & Loss
| Mar 2021 | Mar 2022 | Mar 2023 | Mar 2024 | Mar 2025 | |
|---|---|---|---|---|---|
| Sales + | 1,387.2 | 1,537.5 | 2,279.6 | 3,635.6 | 3,738.8 |
| Sales growth % | -26.76 | 10.84 | 48.26 | 59.49 | 2.84 |
| Expenses + | 1,091.4 | 1,242.2 | 2,047.8 | 2,871.0 | 2,883.5 |
| Cost of goods | 747.7 | 840.2 | 1,503.2 | 2,215.9 | 2,254.0 |
| Employee cost | 193.5 | 219.5 | 282.8 | 360.7 | 394.9 |
| Other costs | 122.0 | 165.8 | 217.7 | 254.0 | 210.3 |
| Operating profit + | 324.0 | 312.0 | 275.9 | 805.0 | 879.7 |
| Operating margin % | 23.4 | 20.3 | 12.1 | 22.1 | 23.5 |
| Other income | 69.8 | 66.1 | 34.4 | 100.5 | 100.2 |
| Interest | 14.0 | 2.7 | 29.6 | 22.6 | 2.9 |
| Depreciation | 14.2 | 13.9 | 14.5 | 17.8 | 21.5 |
| Exceptional items | - | 10.3 | 14.0 | 89.0 | 80.5 |
| Profit before tax | 365.6 | 371.8 | 280.2 | 954.1 | 1,036.0 |
| Tax | 92.9 | 87.0 | 75.6 | 219.1 | 250.2 |
| Profit - disc. ops | - | - | - | - | - |
| Net profit | 272.7 | 284.8 | 204.5 | 735.0 | 785.9 |
| Net margin % | 18.7 | 17.8 | 8.8 | 19.7 | 20.5 |
Revenue from operations
Ratios
| Mar 2021 | Mar 2022 | Mar 2023 | Mar 2024 | Mar 2025 | |
|---|---|---|---|---|---|
| Solvency + | |||||
| Total Debt/Equity | 0.0 | 0.0 | 0.1 | 0.0 | 0.0 |
| Net Debt/Equity | 0.0 | 0.0 | 0.1 | 0.0 | 0.0 |
| Total Debt/Assets | 0.0 | 0.0 | 0.1 | 0.0 | 0.0 |
| Total Assets/Equity | 1.2 | 1.2 | 1.4 | 1.3 | 1.2 |
| Liquidity + | |||||
| Current Ratio | 4.2 | 4.8 | 2.8 | 3.9 | 5.4 |
| Quick Ratio | 3.5 | 3.4 | 2.0 | 2.8 | 3.9 |
| Interest Coverage | 23.1 | 116.4 | 9.3 | 35.7 | 307.6 |
| Performance | |||||
| Gross Margin | 46.1 | 45.4 | 34.1 | 39.0 | 39.7 |
| Operating Margin | 23.4 | 20.3 | 12.1 | 22.1 | 23.5 |
| Net Margin | 18.7 | 17.8 | 8.8 | 19.7 | 20.5 |
| Return + | |||||
| Return on Equity | 14.1 | 13.0 | 8.6 | 23.8 | 20.6 |
| Pre-tax ROCE | 18.5 | 16.2 | 13.4 | 30.5 | 25.6 |
| Return on Assets | 11.3 | 10.8 | 6.1 | 19.0 | 17.4 |
| Pre-tax ROIC | 16.0 | 13.6 | 9.5 | 25.5 | 22.5 |
| Efficiency + | |||||
| Days Payable | 181.0 | 155.0 | 112.0 | 108.0 | 89.0 |
| Days Inventory | 163.0 | 260.0 | 190.0 | 142.0 | 162.0 |
| Days Receivable | 215.0 | 162.0 | 189.0 | 96.0 | 120.0 |
| Fixed Asset Turnover | 7.6 | 7.1 | 10.1 | 10.8 | 8.3 |
| Total Asset Turnover | 0.6 | 0.6 | 0.7 | 0.9 | 0.8 |
| Working Capital | |||||
| Cash Conversion Cycle | 197.0 | 267.0 | 267.0 | 130.0 | 193.0 |
| Working Capital Days | 392.0 | 384.0 | 277.0 | 225.0 | 283.0 |
Ratios
Charges on assets
State Bank of India
No. of Loans: 1
Total Amount : 740.0 cr
HDFC Bank Limited
No. of Loans: 1
Total Amount : 260.0 cr
IndusInd Bank Limited
No. of Loans: 1
Total Amount : 250.0 cr
RBL Bank Limited
No. of Loans: 1
Total Amount : 250.0 cr
Standard Chartered Bank
No. of Loans: 1
Total Amount : 250.0 cr
ICICI Bank Limited
No. of Loans: 1
Total Amount : 250.0 cr
Yes Bank Limited
No. of Loans: 1
Total Amount : 250.0 cr
Axis Bank Limited
No. of Loans: 1
Total Amount : 250.0 cr
CitiBank N.A.
No. of Loans: 1
Total Amount : 7.5 cr


Charges
Company Network

Companies connected through Directors
| Name | Status | Paid up Capital | Common Directors | Address |
|---|---|---|---|---|
| MEDHA RUBICON WATER TECHNOLOGIES PRIVATE LIMITED |
Active
|
3.0 Cr | 1 | Telangana |
| MEDHA LOCOMOTIVES PRIVATE LIMITED |
Active
|
1.0 L | 2 | Telangana |
| MEDHA SMH RAIL PRIVATE LIMITED |
Active
|
50,000.0 | 2 | Telangana |
| MK CAPTIVE ENERGY VENTURES LLP |
Under Process Of Strike Off
|
10.0 L | 1 | Telangana |
| MEDHA BOGIES PRIVATE LIMITED |
Active
|
1.0 L | 2 | |
| SHRI INDRI INFRASTRUCTURE PRIVATE LIMITED |
Strike Off
|
1.0 Cr | 2 | Telangana |
| ECE RAILWAY EQUIPMENT PRIVATE LIMITED |
Active
|
89.6 L | 2 | Telangana |
| MEDHA RAIL PRIVATE LIMITED |
Active
|
1.0 L | 2 | Telangana |
| AYUTEK HEALTHCARE PRIVATE LIMITED |
Active
|
1.0 L | 2 | Telangana |
| MEDHA DAKO-CZ PRIVATE LIMITED |
Active
|
1.5 Cr | 2 | Telangana |
| MEDHA RAILWAY EQUIPMENTS PRIVATE LIMITED |
Active
|
3.0 Cr | 2 | Telangana |
| MEDHA TRACTION EQUIPMENT PRIVATE LIMITED |
Active
|
21.2 Cr | 2 | Telangana |
| MEDHA SERVO DRIVES - RUBICON WATER JV PRIVATE LIMITED |
Active
|
1.0 L | 2 | Telangana |
| MEDHA GANSER FUEL SYSTEMS PRIVATE LIMITED |
Active
|
3.0 L | 1 | Telangana |
Subsidiary Companies
| Name | State / Country | Incorporation Year | Paidup Capital |
|---|---|---|---|
| MEDHA RAILWAY EQUIPMENTS PRIVATE LIMITED | Telangana | 2009 | ₹ 3.0 Cr |
| MITHRA VENTURE PROJECTS INVESTMENT LLP | India | - | - |
| KAPTRONICS PRIVATE LIMITED | Karnataka | 1978 | ₹ 1.2 Cr |
Tofler Score

Risk
 Severe Risk
- No risks identified
Moderate Risk
- No risks identified
Low Risk
- No risks identified
About Tofler Score
Read more
Registered Details
CIN
U31103TG1984PTC004436Incorporation
1984, 42.7 yearsCompany Email
jaganc@medha.comPaid up Capital
₹ 19.7 CrAuthorised Capital
₹ 21.0 CrAGM
Sep 2025Type
FAQ - MEDHA SERVO DRIVES PVT LTD
What is the incorporation date of MEDHA SERVO DRIVES PVT LTD?

The incorporation date of MEDHA SERVO DRIVES PVT LTD is 27 January, 1984
What is the authorized share capital of MEDHA SERVO DRIVES PVT LTD?
The authorized share capital of MEDHA SERVO DRIVES PVT LTD is INR ₹ 21.0 Cr.
What is the paid-up capital of MEDHA SERVO DRIVES PVT LTD?
The paid-up capital of MEDHA SERVO DRIVES PVT LTD is INR ₹ 19.7 Cr.
What is the registered address of MEDHA SERVO DRIVES PVT LTD?
The registered address of MEDHA SERVO DRIVES PVT LTD is P-4/5B, IDA, NACHARAM, HYDERABAD TELANGANA Telangana - 500076
What is the CIN number of MEDHA SERVO DRIVES PVT LTD?
The CIN number of MEDHA SERVO DRIVES PVT LTD is U31103TG1984PTC004436.
Smart Suggestions
- N.E. Electronics Ltd
- Arin Tractors Private Limited
- Ultiro Gas Safety Division Private Limited
- Chamuah Engineering & Machineries Private Limited
- Fiar Electricals Private Limited
- Rupohi Life Marketing Private Limited
- Crystclear Tech India Private Limited
- Sahani Power And Energy Private Limited
- Assam State Minor Irrigation Development Corporation Limited
- Mahavir Enterprises Private Limited
- Royale India Pvt Ltd
- Galaxy Scales & Systems Private Limited
- Pheros & Co (Assam) Pvt Ltd
- Aie Concrete Private Limited
- Eastern Mechnotech Engineering Services Private Limited
- Janata Machinery Stores Pvt Ltd
- Lohit Mercandise Ltd
- Farm Machinery & Tractor Company India Private Limited
- Cmd Enterprise Pvt Ltd
- Aquino Commercials Pvt Ltd
- Anurag Entrade India Pvt Ltd
- Puja Vanijya Viniyog Ltd
- Umrongso Cement Ltd
- Hari Machines Limited
- Orient Electric Limited
- Alfa Transformers Limited
- Gang Engineering Private Limited
- Singh Brothers Works And Engineering Private Limited
- Brex Technology Private Limited
- Akriti Resources Private Limited
- Kelsten Power And Controls Private Limited
- U3S Engitech Private Limited
- Emerve Electronics Private Limited
- Emviot Innovations Private Limited
- Rlvt Elevator Private Limited
- Lavidas Metech Private Limited
- Ysme Electrical Industries Private Limited
- Bs Heavy Industries Private Limited
- Srikhetra Solar Private Limited
- Smruty Fire & Safety Services Private Limited
- Yenggra Manufacturers Private Limited
- Quicksafety Private Limited
- Bignest Agro Private Limited
- Mayur General Engineering Limited
- Bhagirathi Mechanical Products Limited
- Vidhatri E-Automotive Tech Private Limited
- Ultramodern Elevator's And Escalator Private Limited
- Ut Ltd
- T & I Global Ltd
- Nippon Commercial Co Ltd
- Srei Infrastructure Finance Limited
- Continental Valves Limited
- Brahmanand Himghar Limited
- Texmaco Rail & Engineering Limited
- Wires And Fabriks (Sa) Ltd
- Khaitan Paper Machines Ltd
- Ascu Arch Timber Protection Limited
- Mak Engineering Industries Limited
- Emrald Commercial Limited
- Websol Energy System Limited
- Bls Infotech Limited
- Marsons Limited
- Dhanashree Electronics Ltd
- Crystal Cable Industries Ltd
- Peterhouse Investments India Limited
- Durafon Technologies Private Limited
- Effective Enterprises Private Limited
- Riddhi Ispat (India) Private Limited
- Md Industrial Works Private Limited
- Anmraj Trade Company Private Limited
- Preyog Equipments Private Limited
- Mobius Engineering Private Limited
- Analytical Tools And Services Private Limited
- Rhombus Advanced Testing Solutions Private Limited
- Roitra Engineering Services Private Limited
- Bacs Energy Private Limited
- Volt Edge Energy Private Limited
- Touch-Tech Solutions And Services Private Limited
- Ri Mining & Construction Equipment Private Limited
- Chanan Engineering Buildwin Services Private Limited
- Shashi Innovation Private Limited
- Black Sharp Engineers Private Limited
- Conserve Engineering And Technologies Private Limited
- Raipur Hydraulics Private Limited
- Raj Geotech Engg Private Limited
- M.K. Diesels Pvt Ltd
- Vikrant Submersible Pumps Pvt Ltd
- Chhattisgarh Aqua Private Limited
- Dhabriya Polywood Limited
- Gravita India Limited
- Punsumi Foils And Components Limited
- Modern Insulators Limited
- Emgee Cables And Communications Limited
- Autopal Industries Limited
- Autolite (India) Limited
- Samtel India Ltd (Transfer From Delhi To Rajasthan)
- Shyam Telecom Limited
- Shree Tanishq Machineries Private Limited
- Roljack Asia Limited
- Volta Switchgear India Private Limited
- Laxmi Vandana Energy Safety And Saver Private Limited
- Tivoli Equipments Private Limited
- Mccoy Automation And Instrumentation Private Limited
- Erigo Enterprises Private Limited
- Arya Prime Enterprises Private Limited
- Mark & Spark Engineering Private Limited
- Diwakar Renewable & Infra Private Limited
- Tecsol Impex Private Limited
- Avanza Engineering Private Limited
- Him Teknoforge Limited
- Inox Wind Limited
- Kddl Limited
- Re- Bar Couplers India (Pvt) Limited
- Cedrus Biosciences Limited
- Rishabh Ispat Limited
- G.S. Mountain Movers Private Limited
- Acr Instruments And Valves Private Limited
- High Activity Private Limited
- Gvnr Electro-Tech Private Limited
- Anand Aircon Private Limited
- Lifeline Firesafety Private Limited
- Gayson Rolling Mills Pvt Ltd
- Himenviro Environmental Engineering Co. Private Limited
- Mantech Manufacturing Co. Private Limited
- Evoco Agro Private Limited
- Globe Precision Industries Pvt Ltd
- Standard Tractors Limited
- Phulsons Pumps Private Limited
- A Power Himalayas Limited
- Greenchef Manufacturers & Distributors Private Limited
- Tesna Tech Private Limited
- Triveni Turbine Limited
- Leel Electricals Limited
- Fedders Electric And Engineering Limited
- Sab Electronics Devices Limited
- Tentiwala Metal Products Limited
- Electra (Jaipur) Limited
- Linaks Micro Electronics Limited
- Dixon Technologies (India) Limited
- Consolidated Finvest & Holdings Limited
- Zakacoustics Private Limited
- Mensitron Safety Instruments Private Limited
- Interflex Gravure Private Limited
- Sanjay Technomech Private Limited
- H.A.R.S Hitech Engineers (Opc) Private Limited
- Vinpat Machinery (Opc) Private Limited
- Kop Machinery Private Limited
- Oba Digital Automation Private Limited
- Attempt Engineering Solutions Private Limited
- Twinvolt Aircool India Private Limited
- Bimal Water Solutions Private Limited
- Arcee Industries Limited
- Bharat Gears Limited
- Talbros Automotive Components Limited
- Scan Projects Limited
- Omax Autos Limited
- Eon Electric Limited
- Surya Roshni Limited
- Jagan Lamps Limited
- Ist Limited
- Alcon Auto Private Limited
- Osaw Industrial Products Private Limited
- Nidec India Private Limited
- Innotronics Technologies Private Limited
- Tomita India Private Limited
- Tanu Engineering Products Private Limited
- Varun Component Private Limited
- Svelton Energy Private Limited
- Alphazone Engineering Private Limited
- Tech-Machinery And More Private Limited
- Nodal Engineering Private Limited
- Snowtree Advance Engineering (Opc) Private Limited
- Prestigious Technologies Private Limited
- Agribazar Private Limited
- Sukhsolar Engineers Private Limited
- Shahbroz Manufacturing Private Limited
- Amtrex Equipments Private Limited
- Prabhat Hitech Equipments Private Limited
- Valley Minerals & Chemicals J&K Private Limited
- Naqshbandi And Company Equipments Private Limited
- Boom Systems Renewable Energy Private Limited
- H2A Aqua Solution Private Limited
- Mukesh Bhargav Industries Private Limited
- Orionvalley Solar Private Limited
- Supermotors Ev Private Limited
- Fabgear Engineering Private Limited
- Xcanun Science And Tech (Opc) Private Limited
- Ecoclouds Consulting Private Limited
- Preter Powcom Private Limited
- Rezeca Green Energies Private Limited
- Vital India Tractor And Appliances Private Limited
- Green Source Energies Private Limited
- Kguard Solar Electronics (Opc) Private Limited
- Cylisona Electronics And Electrical Private Limited
- Weltherm Home Appliances Private Limited
- Rafiq Innovations Private Limited
- G N A Axles Limited
- Kew Industries Limited
- Fine Agromatics Ltd
- Krishna Engineering Works Limited
- S R Industries Ltd
- Punjab Communications Limited
- Panacea Biotec Limited
- Jagdambay Furnaces Private Limited
- Moxie Engineering Private Limited
- Senior Machinery India Private Limited
- J.P. Mega Machines Private Limited
- Bentex Industrials Private Limited
- Solsys Engineering (India) Private Limited
- Spi Mouldings Private Limited
- Omega Valves Private Limited
- Malkit Agrotech Private Limited
- Hind Fittings And Forgings Private Limited
- Shri Krishna Techniques Private Limited
- Bijli Foundry Private Limited
- Mastercraft Technology Private Limited
- Vridhi Exports Private Limited
- Rajasthani Filters Private Limited
- Landtrac Tractors Private Limited
- Top 10 Advertising Agencies in India
- 10 Reasons Behind the Slowdown in Real Estate Sector in India
- Top 10 Automobile Companies in India
- Top 10 Logistics Companies in India
- Top 10 SEO Companies in India
- Top 10 Finance Companies in India
- Top 10 Digital Marketing Companies in India
- Top 10 Chemical Companies in India
- Top 10 Real Estate Companies in India
- Top 10 Telecom Companies in India
- Financial Terms
- Business Documents
- Company Financial Reports
- Efficiency Ratio
- Balance Sheet
- Debt to Equity Ratio
- Liquidity Ratio
- Profit and Loss
- Profitability Ratio
- Ratio Analysis
- Solvency Ratio
- EBITDA
- Quick Ratio
- Capital Structure
- Networth
- Current Ratio
- Interest Coverage Ratio
- Assets
- Accounts Payable
- Liabilities
- Revenue
- Memorandum of Association
- Articles of Association
