 Benefits
 Dashboard
Not registered yet? Get a free account.
Sign Up


J.J.HOUSE PRIVATE LIMITED
NLeave site?
You're about to leave our website and go to an external link. Are you sure?
J.J.HOUSE PRIVATE LIMITED is a real estate development company that specializes in residential and commercial property projects. It offers services that include project management, property leasing, and real estate consultancy, aimed at enhancing living and business environments while addressing market demand and urban development challenges.
J.J.House Private Limited, is an unlisted private company incorporated on 26 August, 2005. It is classified as a private limited company and is located in Kolkata, West Bengal. It's authorized share capital is INR 3.00 cr and the total paid-up capital is INR 2.75 cr.
Read more

 Buy Dashboard using Credits
 Buy Dashboard using Credits


- and commodity market., silver coins, gold bar
** All rupee values in INR crores. Based on March 2025 numbers.
 40.61%
77.47%
67.3%
2.47%
 -9.01%
84.63%
4.3
0.02
0.93
4.33
-0.09
 Buy Report or Plans
 Buy Report or Plans

Dashboards
Popular Plan-
₹ 449
 Company dashboard
-
 Five year financials and ratios
-
Risk analysis
-
Interactive charts
-
 Company dashboard

Buy credits

View subscriptions
MCA Fillings
-
₹ 349
All financials
-
All financials
-
All annual returns
-
MoA and AoA
-
-
₹ 249
1 Year
-
Latest financials
-
Latest annual return
-
MoA and AoA
-
PDF Reports
-
₹ 799
Financial report
-
Five year financials and ratios
-
Shareholding and group structure
-
-
₹ 1299
Financial+Litigation report
-
Everything in financial report
-
Litigation report on the company
-
-
₹ 2999
Due diligence report
-
Everything in financial+litigation report
-
Peers and financials
-

* GST not included
** Reports & MCA filings will be based on the latest available financials.
** Delivery timelines are on best-effort basis during working hours. Filings 3-4 hours. Reports 24-48 hours.
 Choose number of credits to buy


₹ 449 + GST
* INR 349 for 20+ credits purchase
1 credit = one company dashboard
Locations
 India
(1)
| State | Type | Address |
|---|
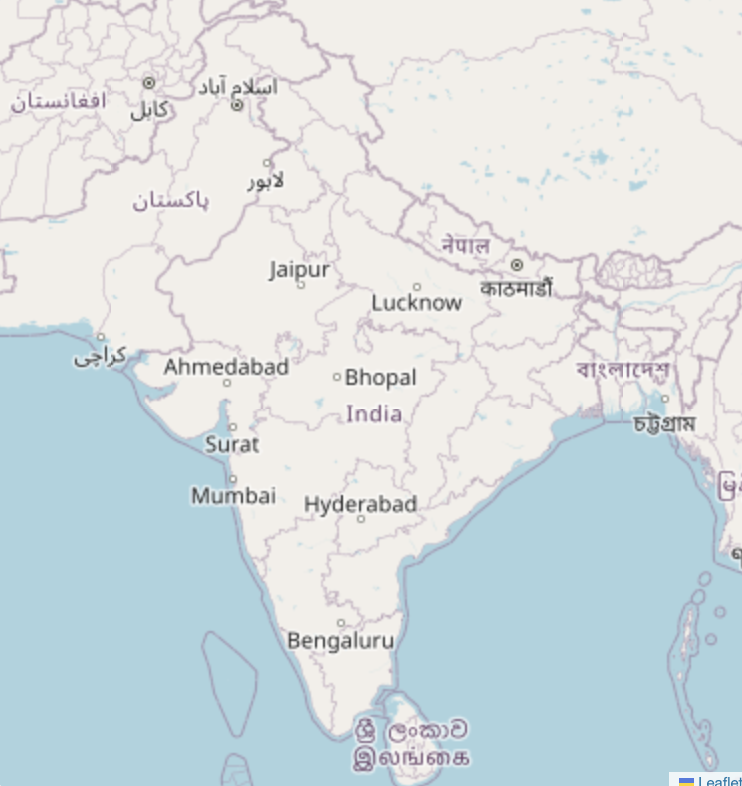
 Locations on Map
 Locations on Map
 Filter (4)
 Filter (4)
Select Tags
Choose Location
People
| Designation | Name | DIN/PAN | Tenure |
|---|---|---|---|
| Director | Harshad Ajmera
Shareholder
|
00479946 | 21 years |
| Director | Pritibala Harshad Ajmera
Shareholder
|
00725035 | 21 years |
Financial Highlights
| Mar 2021 | Mar 2022 | Mar 2023 | Mar 2024 | Mar 2025 | |
|---|---|---|---|---|---|
| Sales | 2,960.1 | 3,200.3 | 2,317.0 | 2,354.0 | 3,310.2 |
| Operating profit | 1.2 | 5.6 | 2.6 | 1.6 | 2.9 |
| Net profit | 0.3 | 3.4 | 1.0 | 0.4 | 0.7 |
| Gross margin | 0.2 | 0.3 | 0.3 | 0.3 | 4.6 |
| Operating margin | 0.0 | 0.2 | 0.1 | 0.1 | 0.1 |
| Net margin | 0.0 | 0.1 | 0.0 | 0.0 | 0.0 |
| Networth | 23.4 | 26.8 | 27.8 | 28.2 | 28.9 |
| Borrowings | 14.0 | 15.5 | 18.5 | 24.3 | 22.1 |
| Assets | 49.5 | 55.9 | 62.9 | 63.3 | 116.8 |
| Debt to equity | 0.6 | 0.6 | 0.7 | 0.9 | 0.8 |
| Current ratio | 1.6 | 1.6 | 1.5 | 1.6 | 1.2 |
| ROE | 1.1 | 12.7 | 3.6 | 1.5 | 2.4 |
| Days payable | 0.0 | 0.0 | 0.0 | 1.0 | 6.0 |
| WC days | 2.0 | 2.0 | 3.0 | 3.0 | 2.0 |

Margins
Balance Sheet
| Mar 2021 | Mar 2022 | Mar 2023 | Mar 2024 | Mar 2025 | |
|---|---|---|---|---|---|
| Equity Capital | 2.8 | 2.8 | 2.8 | 2.8 | 2.8 |
| Reserves | 20.6 | 24.0 | 25.0 | 25.4 | 26.1 |
| Borrowings + | 14.0 | 15.5 | 18.5 | 24.3 | 22.1 |
| Long term borrowings | - | - | - | - | - |
| Short term borrowings | 14.0 | 15.5 | 18.5 | 24.3 | 22.1 |
| Trade payables + | - | - | - | 7.7 | 53.4 |
| Days payable | 0.0 | 0.0 | 0.0 | 1.0 | 6.0 |
| Other liabilities + | 12.1 | 13.6 | 16.7 | 3.1 | 12.4 |
| Other non-current liabilities | - | - | - | - | - |
| Other current liabilities | 12.1 | 13.6 | 16.7 | 3.1 | 12.4 |
| Total liabilities | 49.5 | 55.9 | 62.9 | 63.3 | 116.8 |
| Fixed Assets + | 8.7 | 8.6 | 8.8 | 8.6 | 9.0 |
| Tangible assets | 0.8 | 0.7 | 0.8 | 0.6 | 1.0 |
| CWIP | - | - | - | - | - |
| Intangible assets | 8.0 | 8.0 | 8.0 | 8.0 | 8.0 |
| LT loans and advances | - | - | - | - | - |
| Other non-current assets | - | - | - | - | - |
| Current assets + | 40.7 | 47.2 | 54.1 | 54.6 | 107.8 |
| Inventories | 26.8 | 26.3 | 27.9 | 27.9 | 28.3 |
| Trade receivables | - | - | 2.0 | 2.9 | 14.7 |
| Cash and cash equivalents | 1.2 | 0.4 | 2.2 | 0.2 | 0.1 |
| ST loans and advances | 9.9 | 7.8 | 9.5 | 8.8 | 47.4 |
| Other current assets | 2.8 | 12.6 | 12.6 | 14.9 | 17.3 |
| Total assets | 49.5 | 55.9 | 62.9 | 63.3 | 116.8 |

Total assets
Profit & Loss
| Mar 2021 | Mar 2022 | Mar 2023 | Mar 2024 | Mar 2025 | |
|---|---|---|---|---|---|
| Sales + | 2,960.1 | 3,200.3 | 2,317.0 | 2,354.0 | 3,310.2 |
| Sales growth % | -2.53 | 8.12 | -27.6 | 1.6 | 40.62 |
| Expenses + | 2,959.8 | 3,195.4 | 2,315.9 | 2,354.0 | 3,309.9 |
| Cost of goods | 2,954.7 | 3,191.3 | 2,310.2 | 2,346.6 | 3,157.3 |
| Employee cost | 0.4 | 0.6 | 1.2 | 0.7 | 0.4 |
| Other costs | 3.7 | 2.9 | 3.0 | 5.1 | 149.7 |
| Operating profit + | 1.2 | 5.6 | 2.6 | 1.6 | 2.9 |
| Operating margin % | 0.0 | 0.2 | 0.1 | 0.1 | 0.1 |
| Other income | - | 0.2 | 0.5 | 0.6 | 0.6 |
| Interest | 0.8 | 0.6 | 1.3 | 1.4 | 2.4 |
| Depreciation | 0.1 | - | 0.1 | 0.2 | 0.1 |
| Exceptional items | - | - | - | - | - |
| Profit before tax | 0.4 | 5.1 | 1.6 | 0.6 | 1.0 |
| Tax | 0.1 | 1.7 | 0.6 | 0.2 | 0.3 |
| Profit - disc. ops | - | - | - | - | - |
| Net profit | 0.3 | 3.4 | 1.0 | 0.4 | 0.7 |
| Net margin % | 0.0 | 0.1 | 0.0 | 0.0 | 0.0 |
Revenue from operations
Ratios
| Mar 2021 | Mar 2022 | Mar 2023 | Mar 2024 | Mar 2025 | |
|---|---|---|---|---|---|
| Solvency + | |||||
| Total Debt/Equity | 0.6 | 0.6 | 0.7 | 0.9 | 0.8 |
| Net Debt/Equity | 0.6 | 0.6 | 0.6 | 0.9 | 0.8 |
| Total Debt/Assets | 0.3 | 0.3 | 0.3 | 0.4 | 0.2 |
| Total Assets/Equity | 2.1 | 2.1 | 2.3 | 2.2 | 4.0 |
| Liquidity + | |||||
| Current Ratio | 1.6 | 1.6 | 1.5 | 1.6 | 1.2 |
| Quick Ratio | 0.5 | 0.7 | 0.8 | 0.8 | 0.9 |
| Interest Coverage | 1.5 | 10.0 | 1.9 | 1.1 | 1.2 |
| Performance | |||||
| Gross Margin | 0.2 | 0.3 | 0.3 | 0.3 | 4.6 |
| Operating Margin | 0.0 | 0.2 | 0.1 | 0.1 | 0.1 |
| Net Margin | 0.0 | 0.1 | 0.0 | 0.0 | 0.0 |
| Return + | |||||
| Return on Equity | 1.1 | 12.7 | 3.6 | 1.5 | 2.4 |
| Pre-tax ROCE | 4.8 | 20.4 | 8.9 | 5.2 | 9.5 |
| Return on Assets | 0.5 | 6.1 | 1.6 | 0.7 | 0.6 |
| Pre-tax ROIC | 3.1 | 13.1 | 5.6 | 2.8 | 5.4 |
| Efficiency + | |||||
| Days Payable | 0.0 | 0.0 | 0.0 | 1.0 | 6.0 |
| Days Inventory | 3.0 | 3.0 | 4.0 | 4.0 | 3.0 |
| Days Receivable | 0.0 | 0.0 | 0.0 | 0.0 | 2.0 |
| Fixed Asset Turnover | 338.5 | 370.2 | 264.1 | 273.3 | 368.1 |
| Total Asset Turnover | 59.8 | 57.3 | 36.8 | 37.2 | 28.3 |
| Working Capital | |||||
| Cash Conversion Cycle | 3.0 | 3.0 | 4.0 | 3.0 | -1.0 |
| Working Capital Days | 2.0 | 2.0 | 3.0 | 3.0 | 2.0 |
Ratios
Charges on assets
State Bank of India
No. of Loans: 1
Total Amount : 19.3 cr


Charges
Company Network

Companies connected through Directors
| Name | Status | Paid up Capital | Common Directors | Address |
|---|---|---|---|---|
| ANKURHATI GEMS AND JEWELLERY MANUFACTURERS WELFARE ASSOCIATION |
Active
|
0.0 | 1 | West Bengal |
| RAMESWARA MANSION PROPERTY MANAGEMENT PRIVATE LIMITED |
Active
|
1.0 L | 1 | West Bengal |
| J. J. GOLD REFINERY PRIVATE LIMITED |
Active
|
8.3 Cr | 1 | West Bengal |
Tofler Score

Risk
 Severe Risk
- No risks identified
Moderate Risk
- HIGH LEVERAGE
- LOW INTEREST COVERAGE
- LOW ROCE
- LOW CASH BALANCE
Low Risk
- LOW INVENTORY
- NET MARGIN DETERIORATING
About Tofler Score
Read more
Registered Details
CIN
U70101WB2005PTC104960Incorporation
2005, 21.2 yearsCompany Email
jjgoldhouse@rediffmail.comPaid up Capital
₹ 2.8 CrAuthorised Capital
₹ 3.0 CrAGM
Sep 2023Type
FAQ - J.J.HOUSE PRIVATE LIMITED
What is the incorporation date of J.J.HOUSE PRIVATE LIMITED?

The incorporation date of J.J.HOUSE PRIVATE LIMITED is 26 August, 2005
What is the authorized share capital of J.J.HOUSE PRIVATE LIMITED?
The authorized share capital of J.J.HOUSE PRIVATE LIMITED is INR ₹ 3.0 Cr.
What is the paid-up capital of J.J.HOUSE PRIVATE LIMITED?
The paid-up capital of J.J.HOUSE PRIVATE LIMITED is INR ₹ 2.8 Cr.
What is the registered address of J.J.HOUSE PRIVATE LIMITED?
The registered address of J.J.HOUSE PRIVATE LIMITED is Flat-4A & 4B, 3A, Dr. Martin Luther King Sarani Kolkata Kolkata West Bengal - 700017
What is the CIN number of J.J.HOUSE PRIVATE LIMITED?
The CIN number of J.J.HOUSE PRIVATE LIMITED is U70101WB2005PTC104960.
Smart Suggestions
- Rockline Projects Limited
- Gsl Nova Petrochemicals Limited
- India Green Reality Limited
- Suvidha Infraestate Corporation Limited
- Ratnamani Metals And Tubes Limited
- Superspace Infrastructure Limited
- Indo-American Credit Corporation Limited
- Dev Estate And Infrastructure Limited
- Amba Vijaya Private Limited
- Rajkot Hotel Private Limited
- Pankaj Enka Private Limited
- Rupen Estate Pvt Ltd
- Khushi Industries Limited
- Mahesh Estate Limited
- Manilal Joitarame Chembers Private Limited
- Neminath Land Developers Pvt Ltd
- Ashray Realty Pvt Ltd
- Ambica Realities Private Limited
- Serenity Infrastructure Private Limited
- Galaxy Real Estate Developers (Guj) Private Limited
- Ashta Vinayak Realty Private Limited
- Ribs Integration Private Limited
- Vallabh Realtors Pvt Ltd
- Viral Realtors Private Limited
- Meglon Infra-Real (India) Limited
- Country Club Hospitality & Holidays Limited
- Suprabhath Builders And Developers Private Limited
- Ramaswamy Estates Private Limited
- Rao & Kumar Constructions Private Limited
- Sai Balaji Housing Private Limited
- Sri Adilakshmi Property Developers Private Limited
- Vaishnavi Sai Constructions Private Limited
- Laila Real Estates Private Limited
- Isnar Estates Private Limited
- Laila Credits Private Limited
- Krishnaveni Constructions Private Limited
- Sri Venkatalakshmi Constructions Limited
- S. V. S. Projects Private Limited
- Devaalaya Ventures Private Limited
- Soubhagya Projects Private Limited
- Ridhi Sidhi Projects Private Limited
- Vinayagar Developers Private Limited
- Jd Faberects Private Limited
- P.J.R.R. Hitech Projects Private Limited
- Sujeeka Infra Private Limited
- M.P.R. Housing Private Limited
- Ador Welding Limited
- Housing Development Finance Corporation Limited
- Indian Infotech And Software Limited
- Warden Construction And Finance Limited
- Hit Kit Global Solutions Limited
- Housing Development And Infrastructure Limited
- Krishna Electronics Realities Limited
- Kirloskar Industries Limited
- Mapro Industries Limited
- Khatau Makanji Spinning And Weaving Company Limited
- Nyssa Corporation Limited
- Voltaire Leasing And Finance Ltd
- Rajsanket Realty Limited
- Numero Uno Finance Limited
- Atishay Limited
- Kaycee Industries Limited
- Jri Industries & Infrastructure Limited
- Cvil Infra Limited
- Sunstar Realty Development Limited
- Shree Precoated Steels Limited
- Autoriders International Limited
- Eurotex Industries And Exports Limited
- Man Infraconstruction Limited
- Eclat Industries Limited
- Ranjan Properties & Enterprises Pvt Ltd
- Chanakya Properties Private Limited
- The Muzaffarpur Properties Private Limited
- Tirupati Properties Private Limited
- Sri Ganapati Property Developers Limited
- Super India Agro Farming & Development Limited
- Guinea Builders Private Limited
- Orb Developer Private Limited
- Utopian Info And Properties Private Limited
- Hari Engicon Private Limited
- Mouar Construction Private Limited
- Devendra And Devendra Shelters Private Limited
- Kaushalya Estate Private Limited
- Gangotri Creative Private Limited
- Kaimur Real Estate And Constructions Private Limited
- Asthal Properties Private Limited
- Cohesive Infrastructure Developers Private Limited
- Tribhuvan Awas Private Limited
- Jai Maa Brahmni Infrastructure Private Limited
- Deepshree Properties Private Limited
- Krrish Engicon Private Limited
- Bhuswami Buildcon Private Limited
- Earth Zone Realty Infra Private Limited
- Pyramid Real Estate Private Limited
- Mamta Infrabuild Private Limited
- Ashar Builders & Promoters Private Limited
- Dilaram Constructions & Developers Private Limited
- City Square Mega Mall Private Limited
- Hill Queen Realtors Private Limited
- Rehet Star Developers Private Limited
- United Hibuildtech Private Limited
- Aragon Infratech Private Limited
- Ardas Construction And Suppliers Private Limited
- Mvn Dwellers Private Limited
- Primeview Infrazone Private Limited
- Barahi Bhagwati Consultancy Services (Opc) Private Limited
- Corbett View Developers Private Limited
- Devhomes Infranirman Private Limited
- Jagnath Infratech Private Limited
- Hi Green Realtors Private Limited
- Vbpk Buildwell Private Limited
- Radis Real Earth Industries Private Limited
- Tandon Real Estate & Forex Services Private Limited
- Success Habitate & Developers Private Limited
- Ramgolia Properties Private Limited
- Reliable Estate Private Limited
- Sspdl Limited
- Bhagyanagar Properties Limited
- Tci Developers Limited
- Transport Corporation Of India Limited
- Sea Gold Infrastructure Limited
- May Fair Estates Pvt Ltd
- Lanco Projects Limited
- Sarada Projects Limited
- High Lands Cottages Limited
- Peeti Real Estates Private Limited
- Suraksha Constructions Private Limited
- Sree Avani Estates Private Limited
- Chandana Constructions Private Limited
- Sri Raavi Constructions Private Limited
- Al-Rafai Builders Private Limited
- Sri Sai Hari Hara Estates Private Limited
- Varin And Varin Constructions Private Limited
- Delta Holiday Resorts Private Limited
- Trinity Homes And Resorts Private Limited
- Pearl Merchandise Private Limited
- Citizen Estates Private Limited
- Asb Real Estates Private Limited
- Bhuvana Comforts Private Limited
- Swagruha Dream Lands And Homes Private Limited
- Somsons Builders & Developers Private Limited
- Sushila Estates Private Limited
- Delhi Punjab Real Estates Private Limited
- Rana Infrastructures Private Limited
- Sbj Homes Private Limited
- Mirage Buildcon Private Limited
- York Estates Private Limited
- Kbk Environ Infrastructures Limited
- Option Properties Private Limited
- Matrabhumi Builders Private Limited
- M.K.J. Advisory Associates Private Limited
- Chandigarh Colonisers Private Limited
- D M Associates Private Limited
- Jagan Realtors Private Limited
- Gursukh Developers Private Limited
- Platinum Real Estates Private Limited
- Rangi Associates Private Limited
- Jat Properties Private Limited
- Des Raj And Sons Builders Private Limited
- D S P Real Estates Private Limited
- Jai Maa Mansa Colonizers Private Limited
- Sushma Buildtech Limited
- J.J. Infrastructures Limited
- Thakral Services (India) Limted
- Jck Infrastructure Development Limited
- Suryaprabha Properties Private Limited
- Mangalore Tiles Limited
- Sathya Kumar Estates Private Limited
- Suman Sugiyama Estates Private Limited
- Kemwell Private Limited
- S S Living Concepts (India) Private Limited
- Matushree Builders Private Limited
- Suryakiran Estates Private Limited
- Srivatsa Estates Private Limited
- New Sai Raghava Builders and Developers Private Limited
- Noorani Properties Private Limited
- Woodstock Electronics Private Limited
- Sound Shelters Private Limited
- Casa De Hotels & Resorts Private Limited
- R.R. Real Estates And Resorts Limited
- Prestige Garden Constructions Private Limited
- Centurion Promoters And Developers Private Limited
- Asha Business Centre Private Limited
- Paradigm Properties Private Limited
- L B Gates Private Limited
- Assetz Property Management Services Private Limited
- J. Dossa (Estate) Private Limited
- Jagmohan Lal Gupta Estates Private Limited
- Urban Planner (India) Private Limited
- Chotia Builders Private Limited
- Sapphire Dwellings Private Limited
- Landmark Foundation Private Limited
- Shri Ram Multicom Agency Private Limited
- Jugal Progressive Private Limited
- Sanjay Shania Properties And Developers Private Limited
- Mahato Estate Private Limited
- Sahu Estate Private Limited
- Dinbandhu Enterprises Private Limited
- Mohit Rathor Enterprises Private Limited
- Shiner Silky Construction Private Limited
- Shruti Realcon Private Limited
- Supreme Developers Private Limited
- Shree Housing Developers Private Limited
- Gupta And Company Developers Private Limited
- Hare Lal Construction Company Private Limited
- Sardul Infrastructures Private Limited
- Green Acres Infrastructure Private Limited
- Shlok Builders Private Limited
- Elite Power Projects & Construction Private Limited
- Everlight Realcon Infrastructure Limited
- Bdr Buildcon Limited
- Pearl Apartments Limited
- Uddhav Properties Limited
- Mega Nirman & Industries Limited
- Distinctive Properties And Leasing Limited
- Multipurpose Trading And Agencies Limited
- Himalaya Food International Limited
- Blueblood Ventures Limited
- Camac Commercial Company Limited
- Irc Worldwide Couriers Ltd
- Morgan Ventures Limited
- Real Growth Commercial Enterprises Limited
- Shri Krishna Prasadam Limited
- Sitac Estates Private Limited
- Sharma Infrastructure And Estates Private Limited
- Freshlook Buildcon Private Limited
- Brij Kripa Projects Private Limited
- Vision Global Private Limited
- Sudha Growth Fund Private Limited
- Haripuri Estate Private Limited
- Gopalji Developers & Engineers Private Limited
- Diplomat Security Solution & Infrastructure Private Limited
- Deeman Properties Private Limited
- Top 10 Mobile Companies in India
- Top 10 Logistics Companies in India
- Top 10 IT Companies in India
- Top 10 FMCG Companies in India
- Top 10 MNC Companies in India
- Top 10 Healthcare Companies in India
- Top 10 Pharma Companies in India
- Top 10 Tiles Company in India
- Top 10 Network Marketing Companies in India
- How to Choose Top Marketing Research Website in India
- Financial Terms
- Business Documents
- Company Financial Reports
- Efficiency Ratio
- Balance Sheet
- Debt to Equity Ratio
- Liquidity Ratio
- Profit and Loss
- Profitability Ratio
- Ratio Analysis
- Solvency Ratio
- EBITDA
- Quick Ratio
- Capital Structure
- Networth
- Current Ratio
- Interest Coverage Ratio
- Assets
- Accounts Payable
- Liabilities
- Revenue
- Memorandum of Association
- Articles of Association
